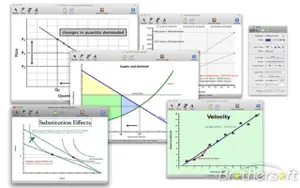
Graph Plot is a software application for data analysis and publication-quality graphing, tailored to the needs of scientists and engineers. The application offers an easy-to-use interface for beginners, and the ability for advanced users to customize analysis and graphing tasks using themes, templates, custom reports, batch processing..
Graph Plot is a software application for data analysis and publication-quality graphing, tailored to the needs of scientists and engineers. The application offers an easy-to-use interface for beginners, and the ability for advanced users to customize analysis and graphing tasks using themes, templates, custom reports, batch processing.
FEATURES:
- Graphing?
With over 70 built-in graph types, makes it easy to create and customize publication quality graphs to suit your needs.
- Data Analysis
Contains powerful tools for all of your analytic needs, including peak analysis, curve fitting, statistics, and signal processing
- Maths & Simulation
For usual engineering and science applications including mathematical operations and data analysis.
- 2-D Visualization
Graphics functions to visualize, annotate and export data and many ways to create and customize various types of plots and charts.
- Optimization
Algorithms to solve constrained and unconstrained continuous and discrete optimization problems.
- Statistics
Tools to perform data analysis and modeling
Control System Design & Analysis
Standard algorithms and tools for control system study
- Export
Export Graph into multly types of formats
版本更新内容:


ICAO英语学习系统总共13款应用
本APP为NWATM定制,旨在提高NWATMB在职管制员应用管制员英语语言的综合能力、使用管制员英语进行通讯的能力,以及使用管制员英语针对一些特殊情况的处理能力


FigrCollage 2 Lite Edition
图形与设计
Fractal 3D
图形与设计
WITH AI - AI绘画
图形与设计
更改图标 和 壁纸主题
图形与设计
AI Pet Adventures
图形与设计
Sketchar:AR 画图 应用
图形与设计
Contractile
图形与设计Graph Plot - Data Analysis and Plotting
图形与设计Flard
图形与设计分享手写笔记
图形与设计